Data Visualization
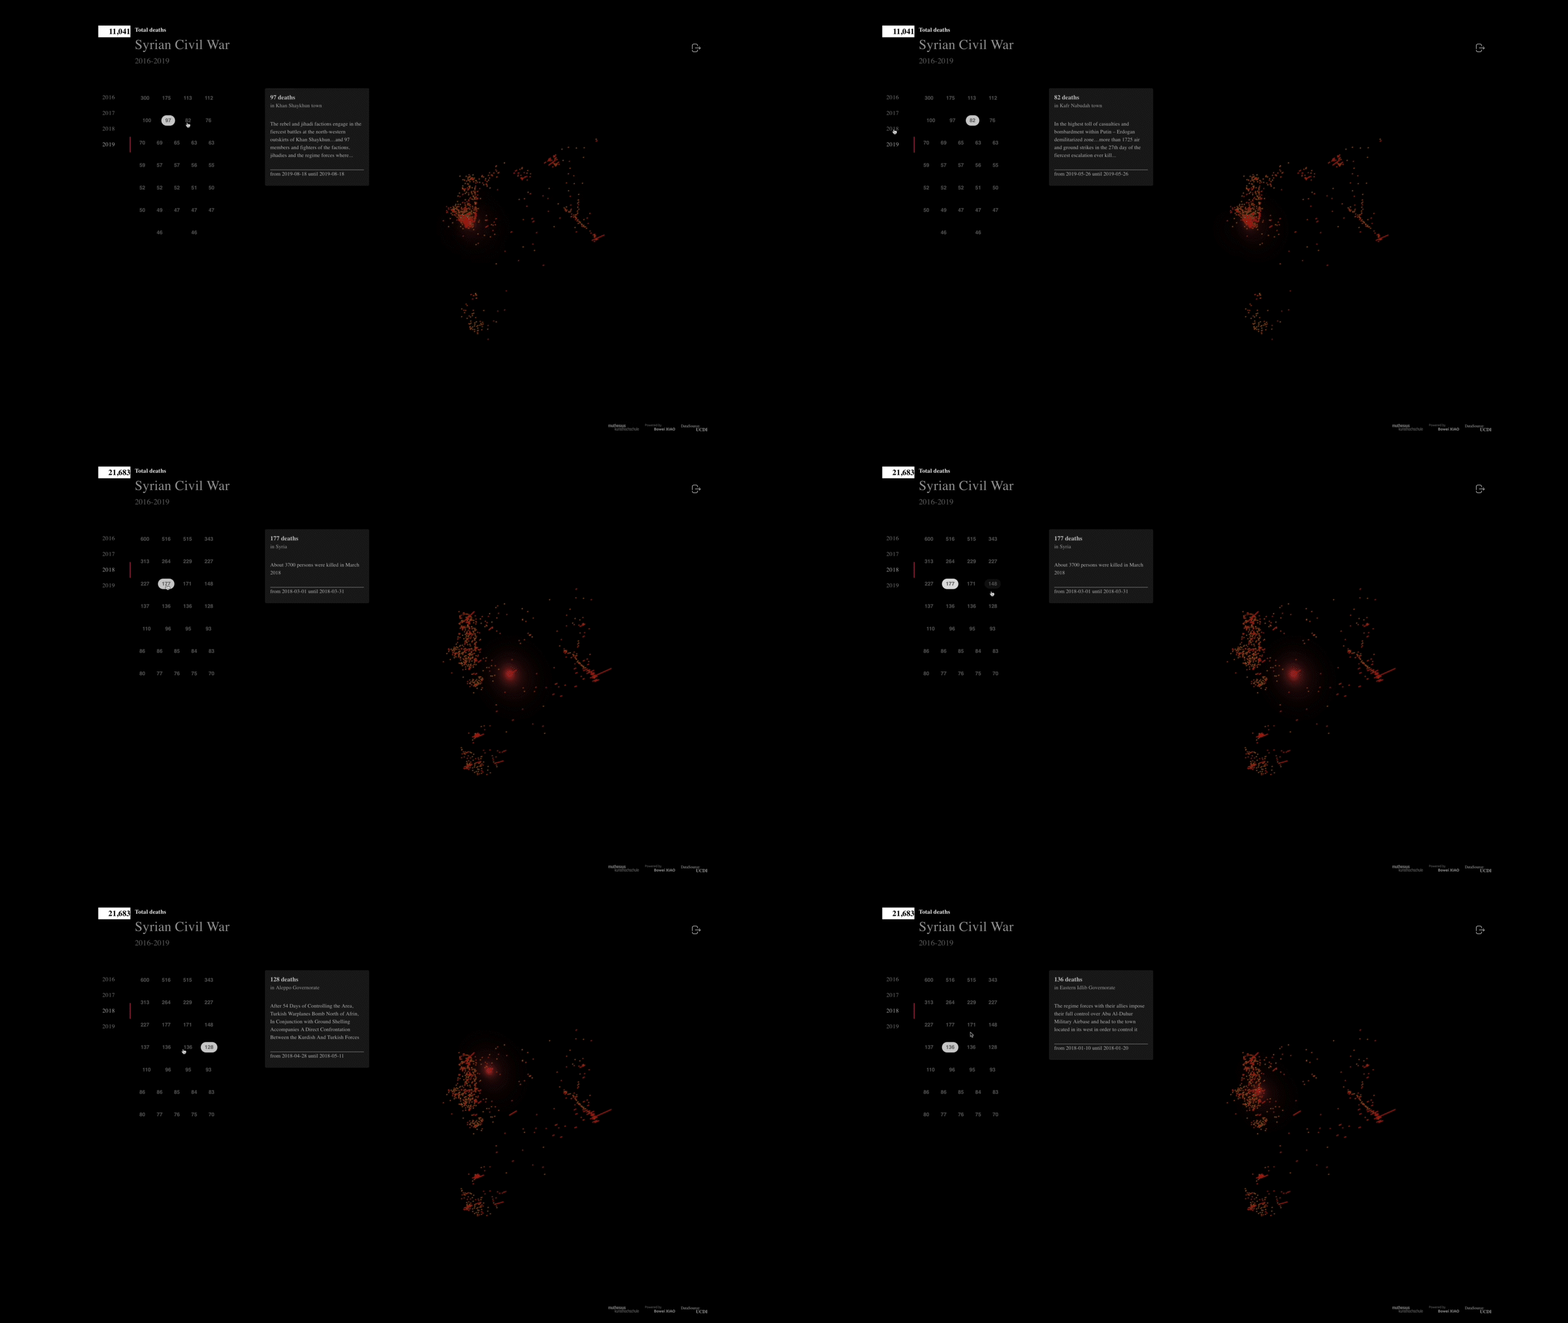
The Syrian Civil War is an ongoing civil war fought in Syria, so far noticed as the biggest war in the 21st century. On 2 January 2013, the UN stated that 60,000 had been killed since the civil war began, four months later, the UN’s updated figure for the death toll had reached 80,000. In the visualisation of the Syrian Civil War, it wasn’t trying to deliver any political opinion, but making people realise, that Syrian citizens, who were murdered in the battlefield, are being recorded into a piece of data but are the real brutal tragedies.

This Data visualization project was fully developed and deployed on AWS (Amazon Web Service). The original codebase please visit my github repository or the Explaination in Red Book.
Syrian civil war
Data of the Syrian Civil War was provided by UCDP - The Uppsala Conflict Data Program, the world’s leading provider of data on organised violence and the oldest ongoing data collection project for civil war. The data were collecting and analysing served as the starting point for visual contents and interactions.
_id: 5ebdcf49a7a5c11ff8853d01
year: 2016
active_year: 1
type_of_violence: 1
conflict_new_id: 299
conflict_name: "Syria: Government"
dyad_new_id: 11973
dyad_name: "Government of Syria - Syrian insurgents"
side_a_new_id: 118
side_a: "Government of Syria"
side_b_new_id: 4456
side_b: "Syrian insurgents"
number_of_sources: 1
source_article: ""SOHR,2016-12-31,About 60 thousand were killed in 2016 and we still wa..."
source_office: "SOHR"
source_date: "2016-12-31"
source_headline: "About 60 thousand were killed in 2016 and we still wait for an interna..."
source_original: "SOHR"
where_prec: 6
where_coordinates: "Syria"
adm_1: ""
adm_2: ""
latitude: 35
longitude: 38
geom_wkt: "POINT (38 35)"
low: 8179
Intuitive illustration in 3D globe
To clarify the war situation, using coordinates, containing in the data strings, to illustrate intuitively on the three-dimensional globe, has been considered. The browser 3D techniques - webGL, and Threejs library are being implemented into visualisation.
Conclusion - rethinking of design and techniques
UX design should not be divorced from technology, and the data visualisation project is a perfect example of the impact of technology in UX design. Data that more than 100,000 rows put great performance pressure on the visualisation with a browser platform. Hence, it was crucial to design a feasible user interface that meets the technical requirements based on understanding the operation of the data. The focus on and use of various emerging technologies also elevated UX design to a new level. In this case, the adoption of real-time 3D rendering technology made the visualization more interactive.